- M
- T
- P
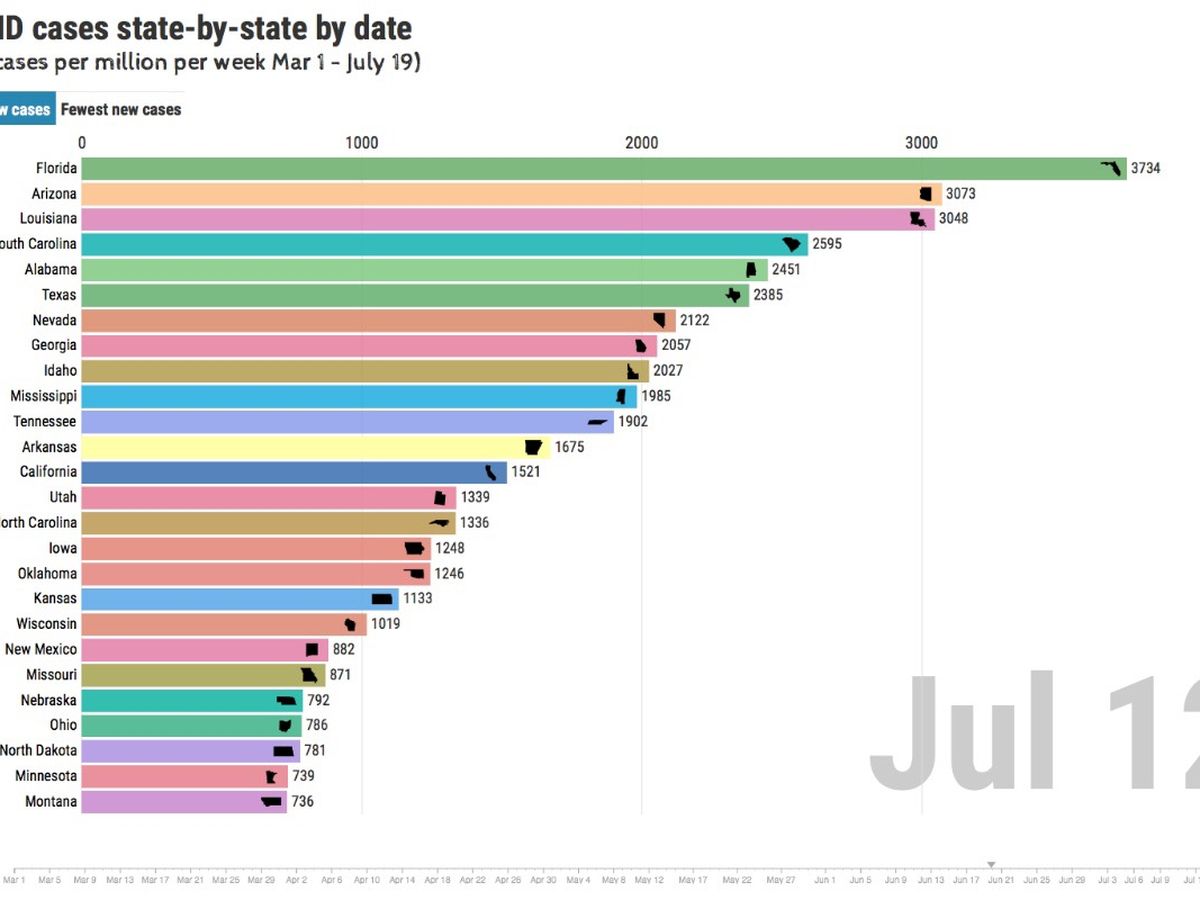
In July 2020, I made a nifty COVID animation chart that really took off, getting almost a half million views in a week, taking down my server for a bit. Since then, I made a half dozen more charts, the total-cases-by-partisanship really blowing up, getting tens of millions of views (and taking down my server again). My server can now handle that much traffic, and I spend about an hour a day keeping the charts up-to-date.
Some have asked for ways to donate to my efforts. So here it is. I've been floored with the donations so far and am not really expecting anything more, but it's here if you'd like!
Thanks!
Some have asked for ways to donate to my efforts. So here it is. I've been floored with the donations so far and am not really expecting anything more, but it's here if you'd like!
Thanks!

